
Classification of brain tumor using devernay sub-pixel edge detection and k-nearest neighbours methodology


Abstract
Any disease can be treated only once it is imaged, detected and classified. This paper proposes a set of algorithms for classification of a brain tumor with better accuracy and efficiency. The proposal uses a JPEG format of the DICOM image fed into three stages namely pre-processing, segmentation using sub-pixel edge detection method and using the nearest neighbor methodology for the detection and differentiation of benign and malignant tumors.
Keywords
Introduction
The field of biomedical imaging is highly used in today’s life for detection of even the smallest possible abnormality in the human body. The primary goal of medical imaging is to extract the meaningful and accurate information according to the region of interest from the images with better accuracy and least possible error output. The various types of imaging methods in the scope of biomedical imaging are computerized tomography (CT) scans, X-rays and magnetic resonance imaging (MRI) scans[1].
CT-scans make use of computer-processed combinations of many X-ray measurements taken from different angles to produce tomographic images of the region of interest of the scanned object, allowing the user to see inside the object without appending a cut on the human body[2].
MRI scan works on the aspects of nuclei to produce detailed images of the human body. It uses a very powerful magnet to align the nuclei of atoms inside the human body and a variable magnetic field that causes the atoms to resonate. This phenomenon of resonance is called nuclear magnetic resonance. The atoms on resonating form a rotating magnetic field that the scanner detects and uses to create an image[3].
Out of all the imaging techniques available for medical purposes, to create high resolution images, the best and non-invasive technique is MRI as it doesn’t involve exposing the body to any kind of harmful radiations[2].
A tumor in any part of the body also known as a neoplasm is a mass formation due to the abnormal growth of the tissues. A tumor found inside the brain can be classified majorly as: primary - the tumor starts in the brain and tends to stay there; secondary - the tumor starts at any part of the body and traverse to the brain, in most cases cancerous in nature; malignant - the tumors which are deadly in nature and tend to increase in mass rapidly; and benign - the tumors which are non-cancerous in nature and generally do not cause any major loss to the human life[4].
According to the American Brain Tumor Association, nearly 80,000 new cases of brain tumor are diagnosed every year within America and approximately 32% of these tumors are malignant or cancerous. Approximately 700,000 people in the USA are living with a tumor in the brain or the central nervous system. The trend also suggests that above 16,000 people will lose their lives to malignant tumors[5].
Further adding on to the statistical trends in India approximately 10 people of every 100,000 people suffer from brain or central nervous system tumor. This is an increasing trend. Out of all the malignant tumor cases in India 2% cases are brain tumors[6].
Proposed system
The main role of the system [Figure 1] as a whole will be to combine together various stages of detection and categorization of the tumor in the image. The first step of the system is the input system where an image of a brain tumor is given as an input. Image enhancement techniques have been widely used in many applications of image processing where the subjective quality of images is important for human interpretation. The next stage into the system is segmentation. Segmentation is the process of partitioning a digital image into multiple segments. The goal is to simplify and/or change the representation of an image into something that is more meaningful and easier to analyze. Image segmentation is typically used to locate objects and boundaries (lines, curves, etc.) in images. The resultant image of the segmentation process is the image showing the tumor highlighted in white. Then a feature matrix is calculated for the tumor and that is fed to a pre-trained classification algorithm which determines whether the tumor is malignant or benign. Executing this system as a whole is a challenging task for any person who is not a computer technician so the system proposes a graphical user interface (GUI) with interactive buttons. The use of GUI in such a system makes the task of executing the whole classification very easy for anyone. The user can easily segment the tumor and classify it to be benign or malignant in just clicks of buttons and within seconds.
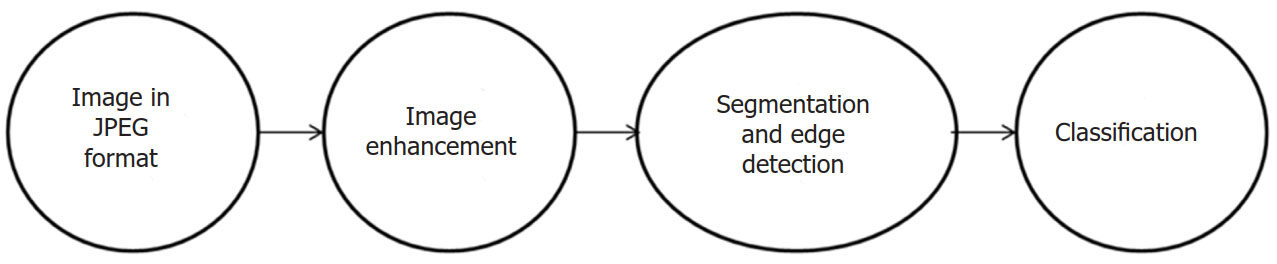
Figure 1. The proposed system
An image from a MRI scanner is received in the form of a DICOM image. For better and faster computation, a DICOM image is converted into the JPEG format before being processed. Then the JPEG image is pre-processed mainly for the removal of noise and enhancement of the image quality. The processed image is then segmented using the sub-pixel edge detector method. Then the required computations are made to evaluate multiple values like mean, standard deviation, IDM, skewness, correlation, and homogeneity. Finally a k-nearest neighbor algorithm is applied for the classification of the tumor in accordance to the above computed values.
Stage 1: enhancement of the tumor image
Image enhancement is used in medical imaging to make the images clearer and to ensure optimum presentation of all digital computer processing [Figure 2]. The importance of enhancement is to aid the interpretation by both humans and computers. Enhancement aims at improving the quality of image by removing noise, enhancing contrast, emphasizing edges and modifying shapes. Many computerized techniques are widely used and applied including the histogram equalization, linear shift invariant filters and morphological filters. For contrast enhancement there are two basic approaches, the first is Top-Hat, where the algorithm enhances the segmented edges of the region of interest and the second where the algorithm deals with the contrast of original image to enhance the segmentation process[7].
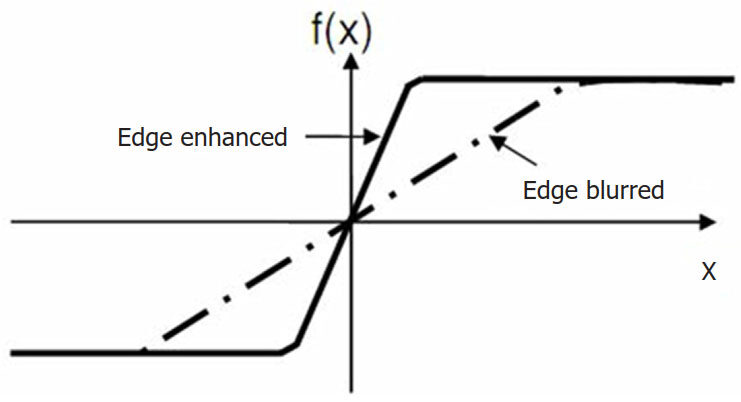
Figure 2. Image enhancement curve
Stage 2: segmentation using sub-pixel edge detection technique
Sub-pixel edge detection consists of multiple stages within itself including edge detection, computing the gradient vector field, computing the sub-pixel edge points, chaining edge points and thresholds with hysteresis[5]. The main motive of the use of an edge detection algorithm is to segment out the edges of the tumor which is detected in the image. The sub-pixel edge detection works on the edges detected by the Canny or the Devernay algorithm for the refinement of the edges using the region-based segmentation techniques on the edges themselves. The line segments consisting of multiple pixels within the edges are basically modified to depict the edges using the minimum number of pixels[8].
Algorithm 1: image_gradient
Input - an image I, scale parameter S;
Output - the image gradient field vector g;
Step 1 - compute and derive the Gaussian filter of standard deviation S;
Step 2 - blur the image by convolution with the Gaussian filter derived in Step 1;
Step 3 - compute the x and y components of the image gradient by centered differences.
Algorithm 2: compute_edge_points
Input - the image gradient vector field g;
Output - a list of sub-pixel edge points;
Step 1 - if the gradient modulus of a given pixel is larger than gradient modulus of the left and right pixels then dub the horizontal edge point provided the gx component of the image gradient is larger or equal to the gy component;
Step 2 - analogously, a pixel whose gradient modulus is larger than the gradient at the pixels above and below is dubbed a vertical edge point if the gy component of the image gradient is larger or equal than the gx component;
Step 3 - if gradient modulus of a given pixel is larger than gradient modulus of the above and below pixels then dub the vertical edge point provided the gy component of the image gradient is larger or equal to the gx component;
Step 4 - finally the Devernay scheme is used either along the vertical or the horizontal axis to compute the sub-pixel position of the edge points.
Algorithm 3: chain_edge_process
Input - the image gradient vector field and a list of sub-pixel edge points computed above;
Output - modified edge list;
Step 1 - each point in the list is evaluated;
Step 2 - the neighbors of each pixel is computed;
Step 3 - edge points are associated with the pixel that is local maximum of the gradient modulus, either vertically or horizontally;
Step 4 - two subsets of the set are formed. The first set for forward chaining and the other for backward chaining;
Step 5 - the elements of each of these subsets with shortest distance of the edge point are selected as the candidates for forward and backward chaining;
Step 6 - then towards the end of the algorithm the previous chains are verified, both unlinking of previous chains and creating of new links are done if the new ones are better.
Stage 3: classification using the k-nearest neighbors
K-nearest neighbor (k-NN) methods is a non-parametric regression methodology. An analytical function of the input-output relationship is used to K closest training vector for a given input feature vector. This algorithm function uses a distance (Euclidean) and a voting function. Other algorithms of the type k-NN also work in two phases of training and testing. In the training phase the data points are given to a n-dimensional space, n being a positive integer. In the testing phase the test data points are fed to the algorithm which in turn generates the nearest data points to the plotted data points on the n-dimensional plane[3,9-11].
Algorithm 4: k-NN classifier
Step 1- determine a suitable distance matrix;
Step 2 - in training phase- plot all the data set pairs as points on a n-dimensional plane;
Step 3 - the data to be tested is plotted in the same plane and the nearest distance matrix is evaluated;
Step 4 - the k-NN are chosen and told to vote for the correctness of the algorithm to determine the best plausible classification result.
Experimentation
A dataset of 210 images of brain tumors of various types was collected initially with the type of the tumor already known. As we know any classification algorithm needs two datasets: train data and test data. So a set of 80 data is initially selected for purpose of training the system to predict the results. The data or the feature matrix is created that stores the values and the labels for all the images in the train data. The rest of the 150 images are used for testing the system to calculate the accuracy percentage of the overall system.
Results
The system is run to distinguish between the two major types of brain tumors - malignant or benign for a dataset of 150 images. Images were equally distributed in the two types, with 75 each for benign and malignant. The figures below are screenshots of the GUI of the system as described above.
In the GUI, there are two buttons first for the load MRI image which is used to select the image of an affected brain from any folder within the computer or within any other connected device. Once the image is loaded into the system it is visible on the left axis and the system goes into standby mode till the user clicks the next button. Once the segment image button is pressed the segmented image is shown on the right axis. The same button also fills up all the edit text field values on the right end under the features tab. These values are calculated from the extracted features of the segmented portion of the image. These 13 values form up the feature matrix that is further used in the classification process. The text-field in front of the type of tumor tab gives the final result that is predicted by the k-NN classifier algorithm in the system.
Figure 3 represent two different tumor images from the test data set that were run on the system and gave out the results as benign tumors. These classifications are completely based on the values of the various features that are calculated during the classification process.
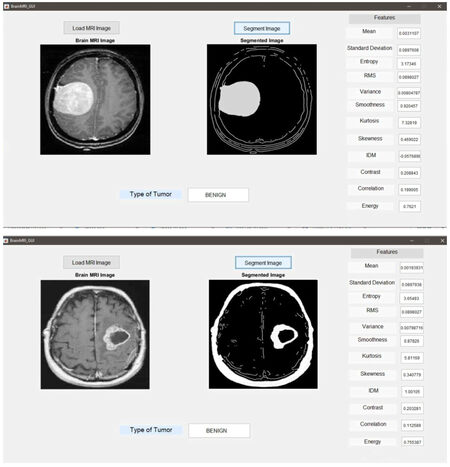
Figure 3. Results depicting a benign tumor
Figure 4 represent two different tumor images from the test data set that were run on the system and gave out the results as malignant tumors. The system also effectively provides the segmentation and classification results for tumors of small sizes.
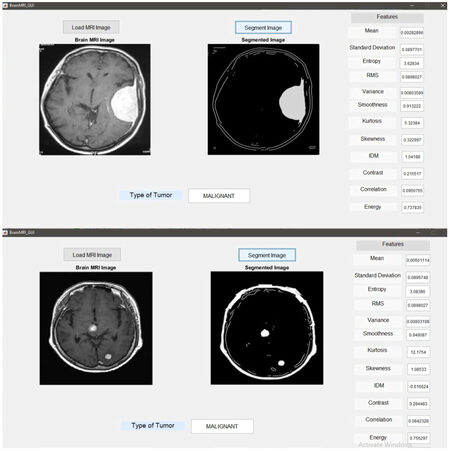
Figure 4. Results depicting a malignant tumor
Analysis and conclusions
The feature matrices calculated in the above step are the main factors of the decision making process of the system. Here the 150 images within the test data set are considered wherein 75 images were benign and the other 75 were malignant. The system was then run for both sets of images - benign and malignant, and results were noted. The same process was run on for 100 iterations for the sole purpose of testing. Once the errors in each set were classified the average of both sets was calculated. Following that the error in the 100 iterations were taken and averaged. Finally the average value of error was taken and the accuracy of the system was calculated. Accuracy percentage = (correctness of the system/total number of observation)*100%.
According to the data in Table 1, the average of 69 results were accurate out of 75 observations using the system that adopted discrete wavelet transform, principal component analysis and the k-NN algorithm for various stages like segmentation, feature extraction and reduction and classification process.
Results and calculations from the testing phase
| Methodology | No. of excepted results | Accuracy percentage |
|---|---|---|
| Using DWT, PCA & k-NN | 69/75 | 92% |
| Using contrast enhancement, sub-pixel edge detection and k-NN | 71/75 | 94.67% |
On the contrary, while using the latest methodologies such as contrast enhancement using the mathematical morphology, segmentation and feature extraction using the sub-pixel edge detection algorithm and the classification using the k-NN, a better observation of 71 accurate results in hundred iterations of testing was given. This leads to an accuracy percentage of about 94.67% on the selected data set.
The above results are capable enough to ensure the operation of the system as a whole on any given dataset.
Future enhancements
The speed of the system using DICOM images is still a challenge and we would want to focus on the DICOM images in the further enhancements. The other motive will be to collect more images for both train and test data sets and to have a better perspective on the testing of the system. The accuracy of the system can then only be confirmed with the highest level of accuracy.
Declarations
Authors’ contributionsConcept and design: Arora A
Data acquisition: Kumar R
Data analysis: Arora A, Tiwari S
Manuscript preparation: Arora A, Shwetha M
Critical revision and finalizing of the manuscript: Venkatesan S, Babu R
Availability of data and materialsThe data were strictly obtained from medical records according to the privacy policy and ethics code of our institute.
Financial support and sponsorshipNone.
Conflicts of interestAll authors declared that there are no conflicts of interest.
Ethical approval and consent to participateDue consent was taken from the patients to participate in the study and separately for the photography. Ethical approval was done according to the hospital and department policy.
Consent for publicationNot applicable.
Copyright© The Author(s) 2018.
REFERENCES
1. Kapoor L, Thakur S. A survey on brain tumor detection using image processing techniques. Proceeding of 7th International Conference on Cloud Computing, Data Science & Engineering - Confluence; 2017 Jan 12-13; Noida, India. IEEE; 2017. pp. 582-5.
2. Brenner DJ, Hall EJ. Computed tomography--an increasing source of radiation exposure. N Engl J Med 2007;357:2277-84.
3. Arora A, Roy P, MD S, Venktesan S, Babu R. k-NN based classification of brain MRI images using DWT and PCA to detect different types of brain tumor. Int J Med Res Health Sci 2017;6:15-20.
4. abta.org [Internet]. Chicago: American Brain Tumor Association; c2018 [cited 2018 Jun 13]. Available from: https://www.abta.org/.
5. Chaplot S, Patnaik LM, Jagannathan NR. Classification of magnetic resonance brain images using wavelets as input to support vector machine and neural network. Biomed Signal Process Control 2006;1:86-92.
6. Dasgupta A, Gupta T, Jalali R. Indian data on central nervous tumors: a summary of published work. South Asian J Cancer 2016;5:147-53.
7. Kharrat A, BenamraneN, Messaoud MB, Abid M. Detection of brain tumor in medical images. Proceeding of 3rd International Conference on Signals, Circuits and Systems; 2009 Nov 6-8; Medenine, Tunisia. IEEE; 2010. pp. 1-6.
8. von Gioi RG, Randall G. A sub-pixel edge detector: an implementation of the canny/devernay algorithm. Image Processing On Line 2017;7:347-72.
9. El-Dahshan ESA, Salem ABM, Younis TH. A hybrid technique for automatic MRI brain images classification. Studia Universitatis Babes-Bolyai: Series Informatica 2009;54:55-67.
10. Sengur A. An expert system based on principal component analysis, artificial immune system and fuzzy k-NN for diagnosis of valvular heart diseases. Comput Biol Med 2008;38:329-38.
Cite This Article
Export citation file: BibTeX | RIS
OAE Style
Arora A, Kumar R, Tiwari S, Shwetha M, Venkatesan S, Babu R. Classification of brain tumor using devernay sub-pixel edge detection and k-nearest neighbours methodology. Neurosciences 2018;5:26. http://dx.doi.org/10.20517/2347-8659.2018.11
AMA Style
Arora A, Kumar R, Tiwari S, Shwetha M, Venkatesan S, Babu R. Classification of brain tumor using devernay sub-pixel edge detection and k-nearest neighbours methodology. Neuroimmunology and Neuroinflammation. 2018; 5: 26. http://dx.doi.org/10.20517/2347-8659.2018.11
Chicago/Turabian Style
Arora, Ayush, Ritesh Kumar, Shubham Tiwari, Mysore Shwetha, Selvam Venkatesan, Ramesh Babu. 2018. "Classification of brain tumor using devernay sub-pixel edge detection and k-nearest neighbours methodology" Neuroimmunology and Neuroinflammation. 5: 26. http://dx.doi.org/10.20517/2347-8659.2018.11
ACS Style
Arora, A.; Kumar R.; Tiwari S.; Shwetha M.; Venkatesan S.; Babu R. Classification of brain tumor using devernay sub-pixel edge detection and k-nearest neighbours methodology. Neurosciences. 2018, 5, 26. http://dx.doi.org/10.20517/2347-8659.2018.11
About This Article
Special Issue
Copyright

Data & Comments
Data


 Cite This Article 0 clicks

 Like This Article 0
likes
Like This Article 0
likes


Comments
Comments must be written in English. Spam, offensive content, impersonation, and private information will not be permitted. If any comment is reported and identified as inappropriate content by OAE staff, the comment will be removed without notice. If you have any queries or need any help, please contact us at support@oaepublish.com.